topical media & game development


extended version
3D Digital Dossiers -- a new way of presenting cultural heritage on the Web
Anton Eliëns, Yiwen Wang, Chris van Riel, Tatja Scholte
abstract
In this paper we give a comprehensive overview of our work on digital dossiers for the presentation
of cultural heritage, in particular contemporary art, on the web using
standard 3D technology.
Digital dossiers allow for navigation using concept-graphs,
and use 3D in an essential manner to present artwork installations,
as 3D models,
as well as all the relevant information needed for understanding
the artwork, and, for curators, for the preservation and possible
re-installation of the artwork(s).
Our discussion encompasses requirements, implementation issues,
and the realization of guided tours in digital dossiers,
that provide a narrative facility as well as tools to
experiment with exhibition parameters in virtual space.
Introduction
Contemporary art is an intrinsic part of our cultural heritage.
Installations, performances, video and other forms of media art,
have the interest of a small
group of adherents, but are in comparison with more traditional
art forms, far more difficult to present to a general audience.
Another problem is that, due to the type of materials
used and the context-specific aspects of these art forms,
the conservation of the works is difficult and require of the conservator an intimate knowledge
of the original intentions of the artist as well as
details of the materials used and the procedure of construction.
In this paper, we report on our work in developing digital dossiers,
with a special focus on the abramovic dossier.
The abramovic dossier
was developed in 2004 as a collective student
project at the Vrije Universiteit, Amsterdam.
The digital dossier presents itself as a digital archive in 3D space, containing
information about the artworks of the
performance artist Marina Abramovic by presenting media content
and relational structures.
In this particular case, the digital dossier presents
the artist Marina Abramovic's artworks,
serving as an information source for museum curators
to conserve and install the artworks.
Our digital dossier introduces innovative features with respect to
navigation and presentation in 3D environments.
For navigation, we designed a concept graph, that links multimedia elements,
supporting arbitrary, that is non-taxonomic, relationships.
These relationships are shown in a hierarchic way, as parent-child
relations.
This structure is dynamic, i.e. the selected information
determines the presented hierarchy
and visualizes parent-child relationships between information nodes.
For the presentation of media content, we designed a content gadget
consisting of
three windows positioned in a way that allows to deal with multiple
media items simultaneously.
The structure of this paper is as follows:
In section 2, we give a brief overview of related research in providing online
access to cultural heritage and a discussion of related information visualization
paradigms.
In section 3, we give some general background concerning the development
of the digital dossiers and state the requirements for the abramovic dossier.
Next, in section 4, we give an example scenario of using the abramovic
dossier, and
in section 5 we describe the realization and implementation of the abramovic dossier.
In section 6 we discuss initial user experiences,
and in section 7 we discuss data representation and content management issues.
The realization of guided tours and tools to experiment with exhibition parameters
of artworks is described in section 8.
In section 9, we discuss presentation issues, and finally, in section 10, we
draw our conclusions and provide a reference to our (mini) digital dossier
construction kit, with which the user can experiment to build his/her own
digital dossier in a domain of choice.
Related work in cultural heritage and information presentation
Digital access to cultural heritage for the general public
as well as research, education and tourism has become an
important issue since the 90�s. At the G7 conference of the
Information Society in 1995G7 (G-7 Ministerial Conference on the Global Information Society), Brussels, Belgium, Feb 25,
a series of pilot projects were approved
to show the potential offered by the Information Technologies.
The Pilot Project N� 5 named �Multimedia Access to World Cultural Heritage�
was implemented and had its first demonstration at ISAD conference in 1996
ISAD (Information Society and Developing Countries Conference), Midrand, South Africa, May 1996 .
For the first time, digitisation of cultural heritage as an important
issue in information society was recognized and considered.
Since then, many applications (e.g. �digital library/museum�, �e-culture�)
were created based on the common interest of cultural heritage in Europe. ECHO (European Cultural Heritage Online),
as the first major project funded by the EU Commission aimed
at creating a growing and evolving multidisciplinary and integrative network
of research institutes, archives, libraries, museums and other institutions
on the one hand, and to integrate their research and corpora of knowledge on the other hand.
In the Netherlands, the research program
CATCH (Continuous Access to Cultural Heritage)
aims at providing new solutions for accessing digital collections,
focusing on the support of collection managers of cultural heritage institutions.
Following the trend,
the Intelligent Multimedia group of Vrije Universiteit Amsterdam
started the cooperation with Netherlands Institute for Cultural Heritage (ICN),
to develop applications to supporting curators in the preservation and re-installation
of contemprary work of art, as described in more detail in section 3.
Similar to many other
cultural heritage projects we encountered many problem
which, taking our abramovic dossier as a reference,
may be summarized as below:
- big volume -- information and media items related to artworks
- wide diversity of media -- including images, videos, as well as 3D models
- multiple relationships -- artworks may belong to multiple categories and link to many items
- context enrichment -- artworks must be placed in a proper context, also aesthetically
- range of users -- from museum curators to kids, and everything inbetween
As an example of volume and diversity the abramovic dossier already contains over
40 texts, 10 reports, 8 interview clips, 82 pictures, a description of 23 types of (art) material,
as well as 3D models of an installation.
Presenting the artwork as such does not
satisfy expert users who want to explore the information context of the artwork,
and gain indepth information about for example the physical properties of the work.
The user type of digital reproduction may range
from museum curators to kids, from professional researchers to people
who like art. An intrinsically difficult question is
how to meet the different requirements for different user types.
information visualization
Concept-relation graphs are a familiar tool in linguistics
and have also been used for a long time in Artificial Intelligence
to describe the semantic relationships in complex domains.
As a navigation instrument it is, for example used in
a kanji learning tool and the
Visual Thesaurus.
The Visual Thesaurus allows also for invoking Google image or document search
from any of the elements of the concept graph, thus giving access to related information
albeit in a non-immersive, disruptive, manner.
Concept graphs or concept maps are also increasingly being deployed for educational purposes,
as testified by a special interest group at the Dutch Digital University.
For a more general overview of concept graphs and concept mapping tools,
see the concept mapping portal.
Many different visualizations have already been proposed to navigate hierarchical information structures, [Schonhage et al. (2000)].
A wellknown example of a 3D information visualization is the 3D cone tree, [Robertson and MacKinlay (1991)].
The 3D cone tree visualizes hierarchical structures and consists of cone objects.
The
motivation of using 3D over 2D cone trees is that 3D visualizations make optimal use of screen space and
provides the opportunity to visualize larger hierarchical structures.
With respect to usability, however, we observe that the cone tree presents all information at once.
In case of a large amount of highly inter-related information structures this could lead to an information overflow.
This observation led us to implement our concept graph in a dynamic fashion, giving only
a partial view of the concept information space.
Background and requirements of digital dossiers
The digital dossier(s) described in this paper were developed in a series
of student projects, in close collaboration
with the Netherlands Institute for Cultural Heritage (ICN).
ICN is a leading, independent knowledge institute for the preservation and management of so-called moveable cultural heritage.
ICN is coordinator of International Network for the Conservation of Contemporary Art (INCCA).
After a first round of the multimedia casus, in which the students
produced an application giving an overview of the INCCA information archive,
but only incidental information about the artists and their
artworks, we decided to focus on case studies of individual artists,
and we introduced the notion of digital dossier.
Like a medical dossier, the digital dossier was meant to give the
information about the artist and the works of art readily at hand,
so that it could effectively be used for the task of conservation
and the re-installation of the artworks.
For a better understanding of the phrase dossier and to distinguish it from the
notion of an archive or library, look at its dictionary definition:
Webster New World Dictionary
- dossier (dos-si-er) [ Fr < dos (back); so named because labeled on the back ] a collection of documents concerning a particular person or matter
- archive -- 1) a place where public records are kept ... 2) the records, material itself ...
We chose for the phrase digital dossier, and not for archive or library,
to stress that our focus lies on presentational aspects, that is the information must
not only be available but also ready-at-hand.
As an example, consider the reading table with a collection of newly acquired magazines and books
and compare that with the archive of literature stored in the cellar or in the form of microfilm.
Spread out on the table you have quick access to material, whereas it takes considerable effort
to bring the other archived material into the focus of your attention.
In other words, although issues of data representation and content management,
as will be discussed later, are clearly important,
our primary interest was with issues of presentation and navigation.
Requirements
The first group (2004 spring) developed a virtual atelier for the Dutch artist Marinus Boezem,
which included an agent for presenting information, [_Agents].
For the 2004 autumn group, we decided to take the work of Marina Abramovic,
a Serbian-Dutch artist who became wellknown in the seventies with performances
with her partner Ulay, and has since then produced numerous installations, videos
and performances with 'high existential impact'.
The directive with which the students where set to work was, quoting Ted Nelson:
everything must be highly intertwinkled.
Since virtual museums are by now a common phenomenon,
and the virtual atelier for Marinus Boezem (that was realized in a previous casus) may be considered to be just a variant of this,
the 2004 autumn group decided to explore alternative ways of presentation and navigation.
As material for the abramovic dossier there was an interview with
Marina Abramovic from ICN, made in cooperation with the Dutch Foundation
for the Visual Arts, and a great collection of videos from the Institute for Time-based Arts (Montevideo).
In addition, a transcription of the contents of the interview
made by Michela Negrini, a student of media art at the University of Amsterdam,
who also provided an interpretation as well as a categorization of the works of art.
Given the material and the categories along which this material was classified,
the students decided to explore the use of concept graphs as an instrument
for navigating the information space.
In summary,
the digital dossier for the artist Marina Abramovic had to satisfy the following requirements:
requirements
- It must serve as an information source for conservators and curators of contemporary art,
- It must present rich media recordings of all artworks, and,
- It must provide background information for the general public (non-expert users).
A scenario of using the abramovic dossier
In this section, we sketch two examples of using the digital dossier.
The first example illustrates how a user may explore the dossier and look at
the artwork 'China Ring'. The second example indicates how an expert user would locate
the information for 'China Ring' and then studies for example the transcript of an interview.
Scenario 1:
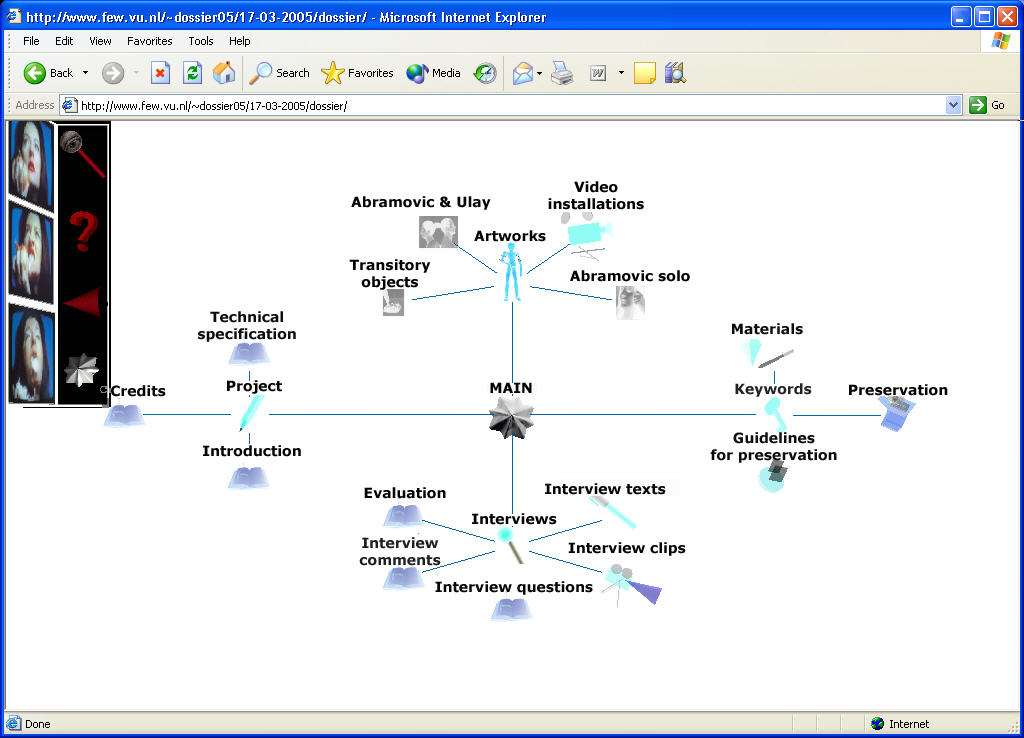
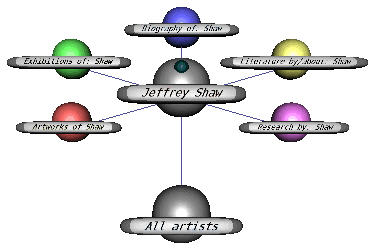
When starting the dossier, it loads the concept graph that is used to navigate through
the available information.
In the center of the concept graph, a shining star is shown to illustrate the root of the information hierarchy,
which is used as the start object. When clicked, a star structure spreads and child objects appear surrounding
the center star object (see fig. 1).
For the purpose of clarity the screenshots have been adapted.
Not only is the originally black background color changed into white,
also the textual information of the nodes has been modified.
.
Clicking on the Interviews node gives an overview of all interview fragments,
then going back
clicking on the information node Artworks and then on China Ring will bring the node for China Ring into focus.
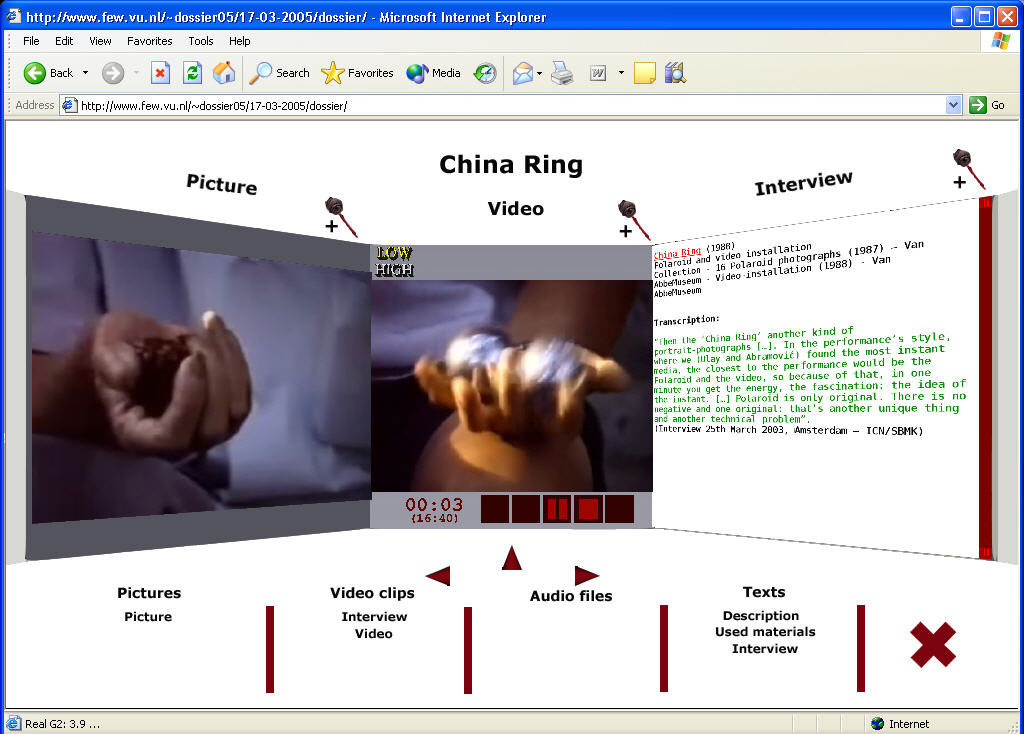
When clicking on the center node China Ring, a content presentation environment appears.
which has three windows to present different types of information, grouped into the categories text,
pictures and video (fig. 2).
If desired, the user can focus on any window by using a zoom function.
When the presentation of media content is finished,
clicking on the close button will result in going back to the concept graph.
Alternatively, the home function of the tool bar may be used to return directly to where we started:
the original shining star.
Scenario 2:
The expert user may want to skip navigating the concept graph and use
the keyword search function. Then from the 'China Ring' node, the (expert) user may either look at the
textual description of the artwork, the transcript of the interview with the artist,
or select the 'Video' node, to explore what other artworks use the material 'Video'.
Realization of the abramovic dossier
The digital dossier was created with VRML (Virtual Reality Modeling Language),
which allows for creating virtual worlds and present them on the web.
The current version requires the blaxxun Contact3D plugin, which is available from www.blaxxun.com
As a user interface for navigating the digital dossier,
we created a concept graph that represents arbitrary information structures
in a hierarchical way.
The concept graph allows the user to detect relations and search for information.
Unlike the 3D cone tree, discussed in section 2, where the complete hierarchical structure is presented,
only a subset of the hierarchy is shown - three levels deep.
The concept graph is implemented as a star-structured hierarchy diagram representing related information objects.
By star-structured we mean that relations between information objects are visualized by lines,
displaying a parent-child relationships structure, showing a centered information object surrounded by related information objects.
This structure is dynamically generated when selecting an information object.
The selected object will be translated to the center of the screen,
involving movement in the X and Y direction. It then becomes a
parent node showing its children around it.
So, the presentation is dynamic and actually determined by the user's choice.
To compensate for the lack of an instant overview, where all information is shown at once,
the user may, as already indicated in the previous section, also use keyword search instead of navigation.
Information objects shown in the concept graph are represented by 3D icons.
These 3D icons visualize a certain type of information.
The icons tell the user what information s/he can expect when clicking on it.
We distinguish between two information types:
information
- conceptual information type -- that represents categories
- content information type -- that represents actual (media) content
The content information type itself consists of different media types.
These include:
media
- text -- providing for example interview transcriptions
- pictures -- representing artworks by images
- videos -- for interviews and recordings of performances
Presentation of media content
Presentation is an essential part of the digital dossier but is separated from navigation.
The digital dossier contains different presentation facilities for 2D and 3D content.
For 2D media content a visualization facility is needed that is able to present video, images or textual information.
This is implemented as a content gadget with three windows.
In each of the three windows the user can view either text, image or video content.
The windows are positioned in such a way that the user can inspect the information simultaneously (see fig. 2).
In our experience, three views can be presented at the same time without much visual distortion.
Below the three windows a list of all content related to the selected information object is displayed.
The available content is presented in lists for each content type.
The user can control on which of the three windows the content selected is displayed,
by using drag-and-drop to the window of choice.
This functionality gives the user some freedom for customization instead of being bounded to a fixed display.
If necessary, the user can focus on a particular window with a zoom option,
to avoid distraction from the other windows.
Incorporating 3D models of artwork installations
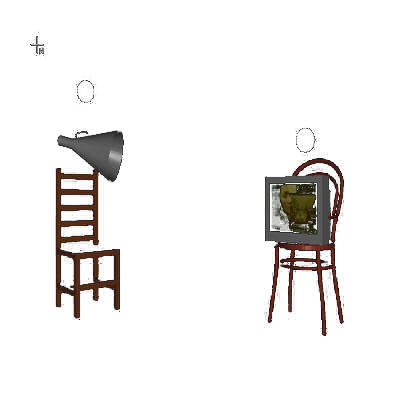
Since we adopted 3D technology, we could easily accommodate a 3D model for one of the installation art works by Marina Abramovic.
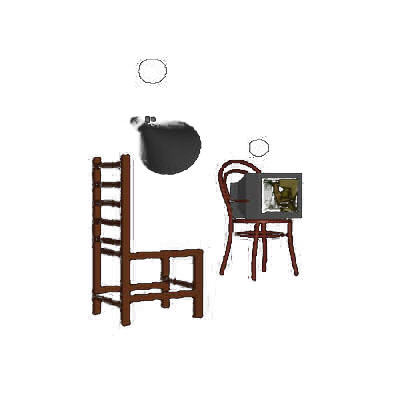
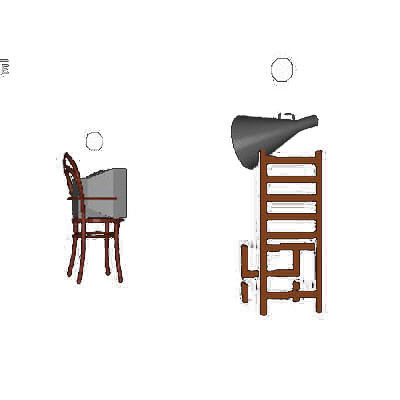
the installation Terra Degli Dea Madre (see figure 3)
The 3D environment demonstrates the interactive exploration of the installation of an artwork.
By manipulating position and/or angle of objects, museum curators can get insight into how the artwork could be exhibited.
Using the concept graph in conjunction with the
presentation gadget resolves the duality of information
and presentation that is inherent for (multimedia) digital dossiers,
and thus promotes what may be called the immersive
experience of digital artist's dossiers.
{\rm\normalsize\hspace{1.0cm} Fig. 3: Reconstruction of Terra della Dea Madre.}
The installation for which the reconstruction was made is Terra dea degli madre,
an installation with two chairs and a television, which was exhibited
in the Stedelijk Museum of Amsterdam, in 1986.
As a starting point, we took a video produced at the time of the exhibition,
which shows the installation in an exposition room in the Stedelijk Museum,
and which contains, apart from comments from Abramovic, also
the video shown on the televison in the installation.
Based on this video we constructed a 3D model of the installation.
In the dossier for Jeffrey Shaw, discussed in section 8, we placed a model of the
installation Revolution in a tool environment, that allows for the manipulation
of exhibition parameters such as light.
Data structures
For developing the abramovic dossier,
we have a fixed number of record-like structures:
structures
- Video -- to display video fragment, including interviews
- Picture -- to present pictures of the artwork
- Artwork -- a grouop node, that contains all information connected to a work of art
- TextItem -- to present text, from the interview or any other source
- MaterialItem -- to present information about material(s) used
- GroupNode -- to combine nodes in the concept graph
- Information -- acts as the outer container for all nodes
All these structures support a set of common attributes,
including shortName, longName, ID, connectedNodesIDs,
and description.
In addition the Video, Picture and Picture have fields
allowing to show a preview image.
And the Video, Picture and TextItem, also have a url
field giving access to the actual information item.
The Information and GroupNode structures are used
for creating the top-levels of the concept graph, whereas the other structures,
such as the Video and TextItem give access to for example
a fragment of an interview and its transcription.
Below an example is given of the data underlying the concept graph of
the abramovic dossier:
concept graph
Information {
informationNodes [
GroupNode {
ID "MAIN"
shortName "Main"
longName "Main"
urlModel "models/cg/main/modelMain.wrl"
description [ "Central information node" ]
connectedNodesIDs [ "ARTWORKS",
"KEYWORDS", "INTERVIEWS",
"REPORT" ]
}
GroupNode {
shortName "Artworks"
longName "Artworks"
description [ "Node that connects to all the artworks" ]
ID "ARTWORKS"
connectedNodesIDs [ "MAIN", "TRANSITORY",
"ULAY", "VIDEOINSTALLATION", "ABRAMOVIC" ]
urlModel "models/cg/artworks/artworksGroup.wrl"
}
## ...
]
}
The Information node collects all available nodes,
and takes care of connecting the individual nodes, based on the information specified for each node.
As an example of an Artwork node, that is an element of the list
of nodes in the Information node, look at:
artwork node
Artwork {
shortName "Terra degla Dea Madre"
longName "Terra degla Dea Madre"
description ["15:40 min, colour, sound."]
ID "AV24"
connectedNodesIDs ["VIDEOINSTALLATION", "DTV24",
"TTV24", "PV24", "CV24", "VV24", "G0"]
urlPreviewImage "images/previewImages/AV24.jpg"
widthPreviewImage 479
heightPreviewImage 349
}
This node is connected to many other nodes, giving access to the information items
that belong to it, such as the video clips of the interview and the associated (transcription) text nodes.
video node
Video {
ID "CV24"
shortName "Interview clip Terra degla Dea Madre"
longName "Interview clip showing Terra degla Dea Madre"
url "interviewclips/interview_terra_degla.avi"
width 320
height 360
urlPreviewImage "images/previewImages/interview_terra_degla.jpg"
widthPreviewImage 320
heightPreviewImage 240
description [""]
connectedNodesIDs ["CLIP", "AV24"]
}
In the url field of a video declaration, the actual video file
is indicated, which should be displayed at a resolution of 320x360,
as specified in the width and height fields.
And finally, as an example of a TextItem, consider:
text node
TextItem {
shortName "Instruction"
longName "Green Dragon Lying instructions for the public."
description ["Text explaining the way the public has to interact with the artwork."]
ID "ITO05"
connectedNodesIDs ["AO05", "INTERACTION"]
url "text/AO05_instruction.txt"
}
For constructing the actual abramovic dossier, we developed
a content management tool, that allows the user to browse
and edit existing nodes, and to insert new nodes into the graph.
The tool as well as example concept graphs are
available online.
|
|
| Fig. 4: Drawing the graph |
Drawing the graph
This section describes how the concept graph is drawn.
When a new node has been chosen to become the center of the concept graph,
we could say that the state of the graph changes. This is where the computation of the new positions of nodes in the concept graph starts. The positions of the nodes are computed as positions on a 2D plane.
See fig. 4. The process can be described in 5 steps:
Step 1: First the node that is selected is placed in the center of the space.
We call this node the center node. The node represents the information the user is focusing on.
Step 2: Next, the available radius for the center node is set.
In our application this value was kept constant for each state.
The radius available must be larger than the space taken in by the center itself otherwise there is no room for drawing other nodes.
Step 3: In this step the radius that is available for each surrounding node of the center node is computed.
The surrounding nodes of the center node will be called the child nodes.
The children of the center node are the nodes with information related to the information of the center node.
The circle around the center node is divided into sectors. The number of sectors is equal to the amount of children of the center node.
The space available for a child is the circle that fits inside a sector.
However, the circle around the child may not intersect with the center node,
this imposes a minimum on the distance from the center to the child.
If this is the case, the circle available for the child node is decreased to not intersect with
the center node (i.e. the radius is derived from the minimum distance and the available space/radius of the center node).
Step 4: Now the actual radius that will be used by a child node can be computed as follows:
First for each node surrounding the child node (which can be regarded as grandchild nodes relative to the center node)
we compute the distance it will be placed from the child node.
We must make sure that the nodes do not intersect each other,
so we arrange them around the child node.
The distance to the child node is equal for each node, where each surrounding node has the same sector size to be drawn in.
The distance between a surrounding node and the child node is taken as
small as possible such that the surrounding node just hits the borders of the sector.
But in the case the center node and surrounding node would intersect,
the center node and surrounding node are put next to each other.
The required radius of a child node is the radius of the circle with the same center as the child node
in which all its surrounding nodes fit. However in case this radius exceeds the available space of the child node,
the available radius is taken as the required radius. Also the child node and its surrounding nodes will be scaled down
to fit inside its available radius.
Step 5: In this last step the position of all the nodes in the concept graph are computed.
The child nodes are arranged around the center node like in step 4.
The distance between the child node and the center node is minimized such that the space required for the child nodes
fits in the sectors without hitting the center node.
The positions of the child nodes can now easily be derived from the distance and the angle each sector is taking.
In case the available radius is smaller than the required radius, the child node will be drawn smaller and the distance of the surrounding nodes to the child node are scaled down to fit the available radius.
If the available radius for a child node is smaller than a predefined minimum, the children will not be drawn.
The positions of the surrounding nodes relative to their child node are computed in the same way as the child nodes. In our application the concept graph could fill a rectangle space. The locations of the nodes are scaled/modified to make optimal use of the entire available screen space.
Resolving conflicts
Because of the (inter) relations of the data, sometimes multiple locations are possible for data items
to be placed. (for example both as center node and as surrounding node of a child
node). We have chosen to draw only one node for a data item: If a node is already present for an information item,
the other possible locations will be left open. Since the center node will be drawn first, and subsequently the children nodes and its surrounding nodes, as a result, most open locations are around the child nodes.
The child node is always related to the center node because all relations are symmetric.
Therefore there is always one gap in the surrounding nodes of a child node.
The locations of the surrounding nodes are rotated such that this gap is in the same direction as the center node from the child node.
To indicate relationships, lines are drawn between related nodes. If a node has a relation to a node that is among its children,
a colored line is drawn.
If the node is not among its children, because the node with the related information was already elsewhere,
a visually less apparent line is drawn.
The surrounding nodes of the child nodes are drawn slightly transparent to make the center node and the child nodes visually more apparent
Animations
When the concept graph goes to a different state (because the focus has changed)
animation is used to show the transition of the old state to the new.
Nodes that represent information that is also needed in the new state,
move to their new locations. Nodes that represent information that is no longer needed disappear
from the screen with a fade out effect and new nodes that are needed appear with a fade in effect.
Such animations are necessary to keep the users' attention.
Usability evaluation of the abramovic dossier
As a first review of the digital dossier we conducted a cooperative evaluation with potential end-users.
A cooperative evaluation is a variation of a think-aloud evaluation, [Dix].
i%%it delivers test results in a relatively short time, [Dix et al, (2001)].
In particular, we were interested in explorative tasks.
The test results give a first indication of the usability of the digital dossier.
As
positive results we found that
the concept graph makes it easy to detect relations between information and that
using a concept graph for navigation appeared to be intuitive for all users.
In addition,
the close relation between the concept graph and presented media seems to reduce disorientation.
As
negative results we found, however, that
the meaning of 3D icons was not well understood.
Also all the users expressed the wish to customize the visual appearance of the concept graph and the icons used.
In general, we conclude that the concept graph supports both intuitive navigation and relationship detection.
However improvement of the visual appearance of the digital dossier is definitely desired.
In summary, when demonstrating the application to
the interested parties, that is ICN and Montevideo,
a number of issues came along, that we will here summarize as a list of questions:
style issues
- what icons should be used to identify the elements of the concept graph?
- what categories and relationships are most appropriate?
- how should the information be displayed, simultaneously or more focussed?
- how do we allow the user to choose between multiple information items?
- how do we avoid visually disturbing elements?
Obviously, although the abramovic dossier was very positively
received, these issues must be dealt with to make it a success.
Having a first prototype, we needed to rethink our application,
not only with regard to its style of presentation
but, as we will discuss in the next section,
also in terms of its underlying data representation.
Data representation and content management issues
To preserve the information stored in the digital dossier for future use, we must reconsider the data representation
i.e. how the information is stored and structured.
To use the information presented by the digital dossier, taking into account future developments in 3D technology
or other application contexts, it has to be independent of formatting information.
This means that the same information instance can be used for other presentations in a relatively easy way.
In particular, in case of the digital dossier the presented information has to be VRML independent.
As an extension to the digital dossier we created a web-based content management tool
that generates XML (eXtendible Markup Language) structured data output from textual information input.
XML is independent of formatting information and therefore suited for multiple presentation forms.
The tool has initially been created for non-expert VRML users that want to create a 3D digital dossier in a relatively quick and easy way,
without programming or adjusting existing code.
By using style sheets, the generated XML output can be presented in various ways by giving it formatting information.
In case of the 3D digital dossier a style sheet conversion is needed from XML to VRML format.
In re-thinking the abramovic dossier,
we needed to re-establish what were our goals in developing this application
and what our primary data sources.
The goal, first of all, is to support conservators in their task of preserving
contemporary art, and to assist them with the re-installation of such artworks.
Our primary data sources are meta-information, coming from the INCCA initiative,
and video-recorded artist interviews, which were initiated by ICN as a means
to record information about contemporary art that would otherwise be lost.
In addition we have media-material, including images and video,
that may be regarded as recordings of the works of art,
as well as the textual interpretations and classifications that exist, or may be
constructed from this material.
At this point, we may remark that one of the pitfalls in creating a cultural heritage application
is to focus entirely
on
the presentation of the artworks themselves, and forget about the
context, that is to make all information accessible in
an adequate manner.
For the next generation of digital dossiers, we stated the following requirements:
next generation dossier(s)
- adaptation of representation to Dublin Core
- XML-based content management, with php forms
- there should also be a possibility to present the information and material in a 'plain' web format
- as well as in (a new version of) 3D dossiers, and
- we should think about the proper presentation parameters.
Dublin Core is the standard used in the INCCA initiative,
to record meta-information about existing information sources.
Using Dublin Core would mean that we could reuse all data collected for INCCA.
For the abramovic dossier, a collection of record-like
structures was developed, together with a simple content-management tool,
written in PHP.
This content-management system must be adapted to be compatible with the
Dublin Core-based resource descriptions, augmented with annotations needed for presentation.
Further, we decided that, along with the 3D presentation of the dossier,
it would be worthwhile to develop a conversion tool that produces
standard web-technology based presentations as well.
This approach allows us to assess the usability merits of the 3D dossiers
in a comparative way.
Finally, as indicated before,
an important issue that must be resolved concerns the proper presentation
parameters.
What do we present to the user?
And how do we allow the user to interact with the material presented?
Guided tours in digital dossiers
Apart from the presentation gadget, which allows for the simultaneous
inspection of multiple media items, in a variety of formats,
we explored the use of guided tours as a means to present the information in a
story-like way, relieving the user of the often cumbersome task
to interact, [ [van Riel et al. (2006)]].
Guided tours, in the digital dossier, may take one of the following forms:
guided tour(s)
- automated (viewpoint) navigation in virtual space,
- the (narrative) presentation of a sequence of concept nodes, or
- an animation explaining, for example, the construction of an artwork.
In practice, a guided tour may be constructed as a
combination of these elements, interweaving, for example,
the explanation of concepts, or biographic material of the artist,
with the demonstration of the positioning of an artwork in
an exhibition space.
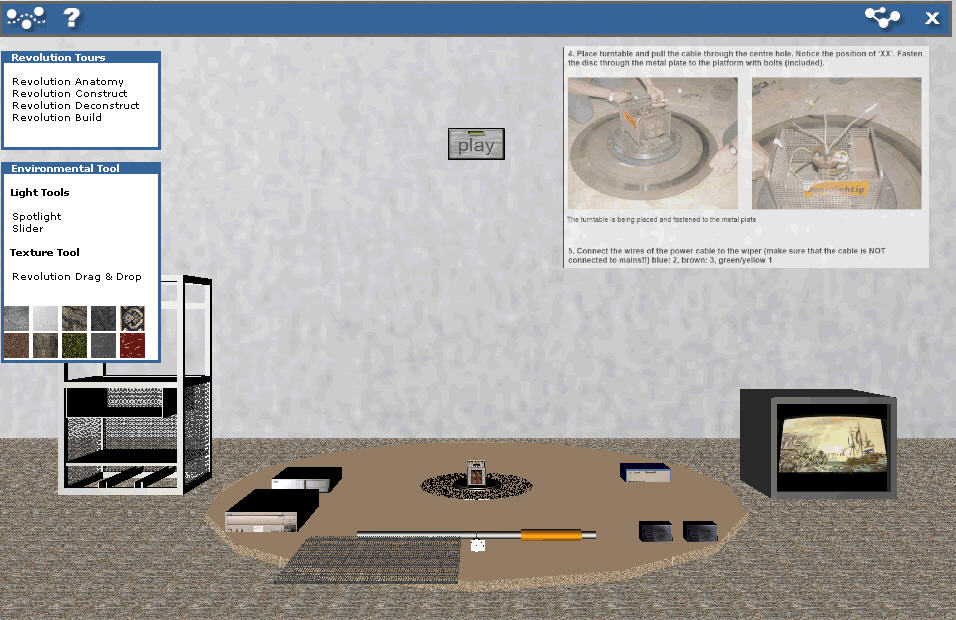
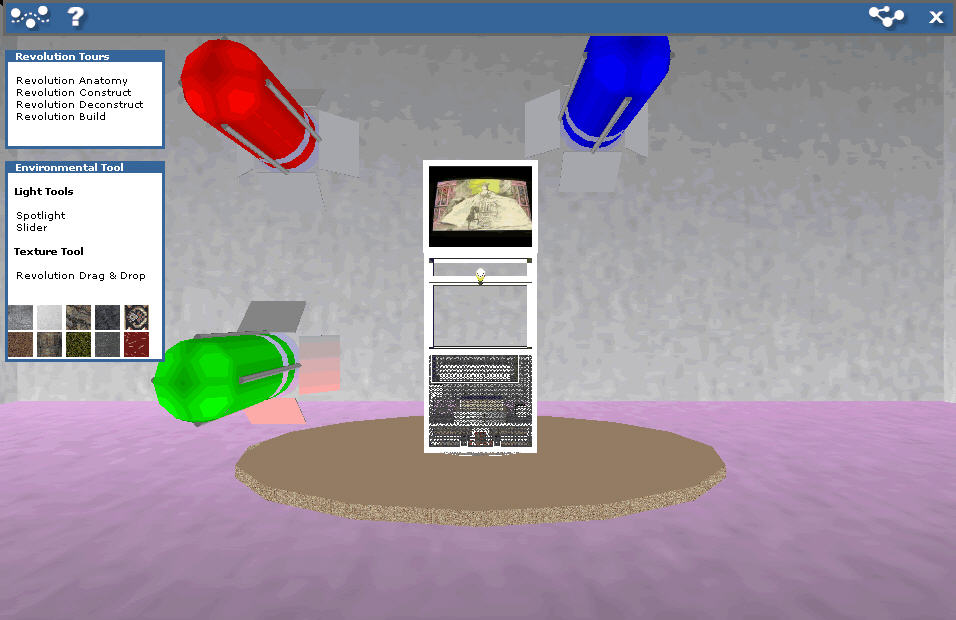
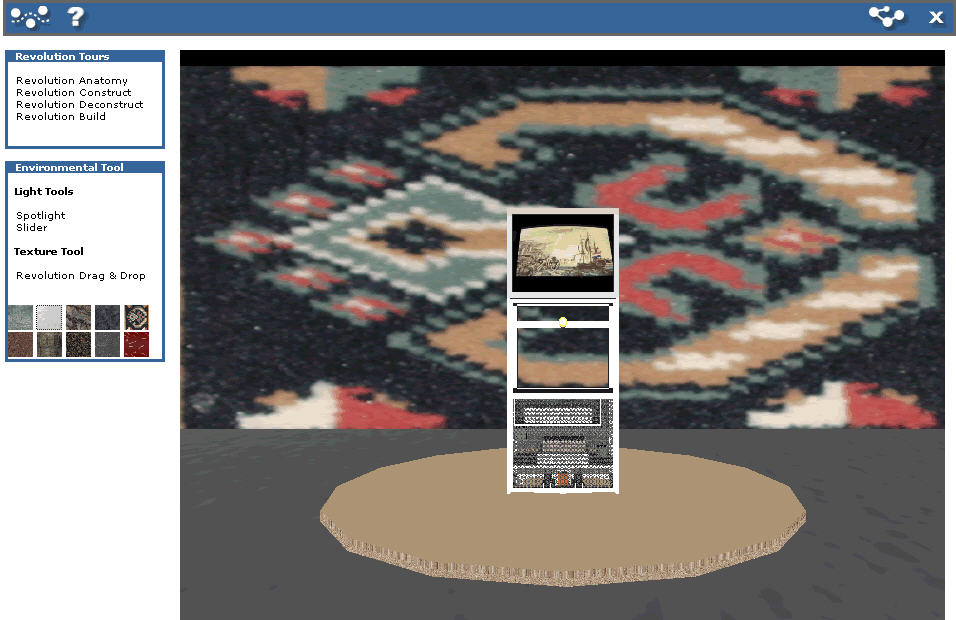
A special case of a guided tour is the tool environment constructed for
the Revolution installation of Jeffrey Shaw, which allows for experimenting
with the (de-) construction of the installation (fig. 5) and exhibition parameters (fig. 6).
Research issues, in the construction of guided tours, encompass:
issues
- the selection of items in the guided tour, as well as
- the presentation of these items in an immersive manner.
Immersion, here, means that we strive for a seamless transition
between the presentation of conceptual material and visual material,
such as video registrations or 3D models of the artworks.
Realization of guided tours
As mentioned in section 5,
as 3D technology we used VRML to develop the digital dossiers.
The technical properties of VRML, with regard to its internal communication
structure, allows for the creation of guided tours using events, which communicate with
the digital dossiers to mimic user interaction.
In more detail, VRML environments consist of input and output channels
that are used to send or receive events (i.e. internal commands).
These events are used to activate functions present in the digital dossier.
In other words, guided tours operate by a
sequence of events, mimicking user interaction (e.g. mouse clicks or key strokes),
that communicate with functions
with specific pre-defined values, fired at specific pre-defined times.
A more sophisticated approach would be to create a strategy to generate sequences of events.
Future research -- intelligent guidance
Our overall aim is to arrive at a general framework for artist's digital
dossiers, that provide intelligent guidance
to both the expert user, responsible for the
future re-installation of the work(s),
and the interested layman, that wishes to get acquainted
with a particular work or collection of works.
In general, there are two techniques that we can apply to provide
guidance:
guidance
- filtering the information space according to the user's
perspective, and
- intelligent agents, that (pro) actively aid the user in searching
the information space.
Filtering the information space
may be used
to restrict the concept graph that defines the navigation
structure,
by stating assumptions with respect to the relevance
of particular categories from
a user's perspective.
This has been applied, for example, in the dossier Jeffery Shaw, discussed in section 9, where only specific types
of content were shown, based on attributes and properties
selected by the user.
In [_Agents] we have investigated the use of embodied
agents in a digital dossier for the artist Marinus Boezem.
In our current research, however, we will very likely
not use embodied agents.
Our goal is to arrive at an advice function, that offers the user at any
navigation point a choice of continuations and/or a selection of guided tours,
focussing on a topic of interest.
For selecting the items to be presented in a guided
tour, the most obvious way is to pre-define a sequence based
on user profiles.
Very likely this can be done in a more flexible way in a rule-based
manner, applied to a template tour.
More interesting, however, is to investigate whether guided tours
can be generated dynamically based on tracking actual user interaction
of (expert) users, using techniques from prediction theory, as
explained in section 6b.
For the selection of items in guided tours and the generation of interesting
sequences, we will explore the use of prediction theory.
As explained in [Cesa-Bianchi and Lucosi [2006]], prediction theory uses a model of prediction
based on expert advice.
However, instead of the traditional loss function, used in a stochastic
approach, prediction theory uses a regret function,
which expresses the difference between an actual prediction and the advice of a collection of experts.
An expert, in this context, is an abstract entity, that may be either
embodied by an algorithm, a random selection, or an actual expert.
We will investigate, for the construction of guided tours, whether it is
possible to generate interesting sequences by using a (sequence of) prediction(s)
that minimizes the regret function, which respect to the navigation sequence(s)
recorded from actual expert users.
In particular, we will strive for implementing the advice function, in a generic way,
by means of a learning mechanism that extracts recommended continuations and
guided tours from tracking expert user navigation.
Presentation issues
As a follow-up on the abramovic dossier, the 2005 Casus group developed
a digital dossier for the artist Jeffrey Shaw.
One interesting aspect of
the dossier for Shaw is the availability of a tool environment to learn about
the construction and de-construction of the Revolution installation and to
experiment with the exhibition space parameters of the artwork, such as the
lighting conditions, and the color and texture of the walls and the floor,
as illustrated in section 8.
With the Casus 2005 group there was, however,
a strong resistance against using 3D for the concept graph navigation
mechanism. So we explored a mixed approach, using 2D for the concept graph,
and 3D only for the representation of the Revolution installation,
in the tool environment mentioned above.
Nevertheless, although the dossier for Shaw does
realize many of the goals set for the next generation dossier,
indicated in section 7, it did fail in providing an immersive application,
in the sense indicated in section 3. It did not achieve a
natural transition between browsing the concept space
and inspecting/experiencing the media recordings of the artwork,
thus disrupting the natural flow of attention, as we may call it
of the user of the dossier. Nevertheless, as we observed in [Schonhage et al. (2000)]
with regard to the visualization of business processes, the effective
use of 3D visualizations does require a certain degree of literacy,
that is visual literacy, from the side of the user.
|
|
| Fig. 7: Uniform node icons |
Representations and icons
In this section we compare the representation used in the
cone trees with our concept graphs.
In addition we list the advantages and disadvantages for
the representation of nodes in the concept graph using respectively
3D icons and uniform 2D icons, as used in the dossier Shaw
discussed in section 8.
cone trees in 3D
+ 3D visualizations of cone trees make optimal use of screen space and provide the opportunity to visualize larger hierarchical structures.
- The cone tree presents all information at once. In case of a large amount of highly inter-related information structures this could lead to an information overflow.
concept graph in 3D -- the abramovic dossier
+ The 3D concept graph presents information nodes in 3 levels of the hierarchy. By move and click, the 3-level structure changes dynamically due to the center node. It offers an overview of multiple relationships among different information nodes.
+ The information nodes are created as 3D models mimicking real objects. A variety of realistic models give users a direct and clear expression related to the original objects.
- The complicated relationships between lines, models in the concept graph might confuse users, especially non-experts. More explanation or guided tours are needed.
- Some 3D models might mislead users. Some abstract 3D models are made based on artist�s definition/explanation and designer�s understanding. It is not precise enough to present without any misunderstanding or slight errors.
concept graph in 2D flash -- dossier Shaw
+ The 2D flash version of concept graph is very easy and friendly to users without too much confusion and difficulty.
- The information nodes in same style/template are not able to provide a vivid and rich image of the hidden information until click for the content presentation.
On the notion of immersion
The abramovic dossier was meant to complement
the information available in other online resources,
by providing an alternative interface to the material.
In particular we wished to avoid the common menu and lists structure
that forces the user to switch back and forth between the media material
and the information giving access to that material.
For an understanding of the notion of immersiveness we refer to [[Bolter and Grusin 2000]] and [Grau (2003)].
In any medium, according to [[Bolter and Grusin 2000]], there are two forces at work:
immersion
- immediacy -- a tendency towards transparent immersion, and
- hypermediacy -- the presence of referential context
Immediacy occurs when the medium itself is forgotten, so to speak,
as is (ideally) the case in realistic painting, dramatic movies,
and (perhaps in its most extreme form) in virtual reality.
Hypermediacy may be observed when either the medium itself becomes
the subject of our attention as in some genres of modern painting,
experimental literature and film making, or when there is an explicit
reference to other related sources of information or areas of experience,
as in conceptual art, many web sites, and also in CNN news, where apart from
live reports of ongoing action, running banners with a variety of information
keep the viewers up to date of other news facts.
Immersiveness, in other words, is accomplished when the application
becomes in some sense transparent, without the user becoming aware of
its referential nature. Although an impossible task as such,
in creating the abramovic dossier we strived for developing an
immersive application, that allows the user to experience the media
recordings of the artworks within the information space represented
by the application, as for example in a virtual museum.
However, given the complexity of the concept space
associated with the works of an artist like Marina Abramovic,
the virtual museum solution did not seem appropriate, and, as
described section 3, we decided to use a concept graph
as a navigation mechanism, with an associated presentation gadget that
is as much as possible embedded in the concept graph, and as it were pops
out of the graph when to user wants to focus on the media presentation of
the artwork. Additionally, when exploring the possible choices offered by
a the part of the concept graph presented, the user will also get a preview
of the material associated with the nodes.
Conclusions
Digital dossiers provide an efficient means to present
cultural heritage on the web, including media-rich representations of
artworks as well as 3D models of artwork installations and
the information needed for understanding the artwork in the context
of its production and (re-)installation.
Digital dossiers provide support
for navigating the
information space by means of concept graphs.
Instead of presenting a complete view of the hierarchy,
the concept graph shows only a subset of the information, and allows
in this way for arbitrarily complex information structures.
The results of an initial evaluation look very promising for
using the concept graph as a navigation paradigm.
Evaluation indicates that it is relatively easy to use and
that it supports exploratory tasks rather well.
Additional tools, such as an interactive model illustrating the de-construction
of an artwork installation, may support curators in their task
of preservation and re-installation of artworks.
Clearly, digital dossiers are not only useful to present information about contemporary art,
but also in for example the domain of scientific communication, which also requires that
users may experiment with models to gain better insight in the functionality
and ideas underlying for example systems in physics.
Recently, we have a submitted a research proposal to extend the application of
digital dossiers to the domain of scientific communication and to continue
our research on guided tours in digital dossiers under the name
I-GUARD (Intelligent Guidance in Archives and Digital Dossiers).
For those interested to experiment with the creation of digital dossiers,
a minidossier is available
for download.
Acknowledgements
We gratefully acknowledge the contribution of the following people to the development of the digital dossier.
Students of the
Vrije Universiteit Amsterdam, Tim Verweij, Olav van Zon, Eric de Boer, Pascal Snijders Blok, Olaf van Zon.
Students of the
Universiteit van Amsterdam, Abeer Mahdi, Jina Menke, Michela Negrini, and the
Technische Universiteit Delft, Jurgen Koster
From the
Netherlands Institute for Cultural Heritage, Ijsbrand Hummelen and in particular Tatja Scholte,
and from
Montevideo, Bart Rutten, Gaby Wijers.
References
- [Remediation] {\rm\sc Bolter J.D and Grusin R. 2000},
- Remediation -- Understanding New Media,
MIT Press
- [Prediction] {\rm\sc Cesa-Bianchi N. and Lucosi G. 2006},
- Prediction, Learning, and Games,
Cambridge University Press
- [Dix] {\rm\sc Dix A, Finaly J, Abowd G, Beale R, 2001} ,
- Human Computer Interaction,
second edition, 2001.
- [Navigate] {\rm\sc Eliens A., van Riel C., Wang Y. 2006},
- Navigating media-rich information spaces using concept graphs -- the abramovic dossier,
Proc. InSciT2006, 25-28 Oct. 2006, Merida, Spain
- [VirtualArt] {\rm\sc Grau O.} 2003,
- Virtual Art -- From Illusion to Immersion,
The MIT Press
- [ {\rm\sc Hoorn J., Eliens A., Huang Z., van Vugt H.C.,},
- {\rm\sc Konijn E.A., Visser C.T. 2004,} Agents with character: Evaluation of empathic agents in digital dossiers,
Emphatic Agents, AAMAS 2004 New York 19 July - 23 July, 2004
- [Guide] {\rm\sc Riel C. van, Eliens A., Wang Y. 2006},
- Exploration and guidance in media-rich information spaces: the implementation and realization of guided tours in digital dossiers,
Proc. InSciT2006, 25-28 Oct. 2006, Merida, Spain
- [Cones] {\rm\sc Robertson G.G. and MacKinlay J.D. 1991} ,
- Cone trees: animated 3D visualizations of hierarchical information,
Proc. of the SIGCHI Conference on Human factors in computing systems: Reaching through technology, 189 194, New Orleans, Louisiana, United States, March 1991.
- [Gadgets] {\rm\sc Schonhage, B., van Ballegooij, A., Eliens, A. 2000},
- 3D gadgets for business process visualizations,
Proc. of the fifth symposium on Virtual reality modeling language (Web3D-VRML), 131 - 138, Monterey, California, United States, February 2000.
- [Present] {\rm\sc Wang Y., Eliens A., van Riel C. 2006},
- Content-oriented presentation and personalized interface of cultural heritage in digital dossiers,
Proc. InSciT2006, 25-28 Oct. 2006, Merida, Spain
(C) Æliens
27/08/2009
You may not copy or print any of this material without explicit permission of the author or the publisher.
In case of other copyright issues, contact the author.